Gene therapy clinical trials promise transformative breakthroughs in treating genetic disorders and pushing healthcare boundaries. Our 2019 report about companies active in CGT trials revealed that Iovance and Intra-Cellular Therapies stood out and that big pharma such as GSK, Celgene, Pfizer, and MSD were jumping into the space. The most investigated indications were neoplasms, hemophilia B, and osteoarthritis.
Following up on our top-level 2019 analysis, this article presents the latest updates regarding the landscape in CGT clinical trials.
Research Methodology
We researched the clinical trials of over 300 companies (Ιmage 1) that between 2014 and 2023 have been running industry-sponsored clinical trials in Cell and Gene Therapy to:
1) identify the top Therapy Areas (TAs) toward which Cell and Gene Therapy research is directed (A semi-automated way was employed according to which conditions/indications from clinicaltrial.gov were categorized into broader therapeutic areas /categories)
2) identify the top players ranked by the number of CGT clinical trials across all phases of development and the top players ranked by the number of trials in each clinical trial development stage
3) find out how the number of clinical trials (at each stage) has evolved from 2014 to 2023
4) find out how the number of companies involved in CGT research with assets at any stage has changed between the period 1998-2018 and the period 2019 to 2023
5) identify new players that have emerged in the last five years.

Image 1: Word cloud depicting all the players in the CGT space that conducted clinical trials from 2014 to 2023
Which clinical trials were considered for the analysis?
For the purposes of the analysis, the trials that were delivered as results from clinicaltrials.gov when searching for the keywords “Cell Therapy OR Gene Therapy” and met the criteria below were considered.
List of criteria:
- Starting date between 2014 and 2023
- Funded by industry (The term industry-sponsored applies to the following cases: Industry, Industry|NIH, Industry|NIH|Other, Industry|Other, Industry|Other|NIH, NIH|Industry, NIH|Other|Industry, Other|Industry, Other|Industry|NIH and Other|NIH|Industry)
- Trial status: Active, Not recruiting, Available, Completed, Enrolling by Invitation, Not yet Recruiting, and Recruiting
- Phase: Early phase 1, phase 1, phase 1|phase 2, phase 2, phase 2|phase 3, phase 3, phase 4 (Trials whose trial phase was either not specified or not applicable were not considered).
Key Analysis Findings
Νeoplasms are the primary Therapeutic Area targeted by CGT research.
The Top 3 therapeutic areas where CGT research is applied are neoplasms, blood and lymph conditions, and immune system diseases (based on the absolute count of appearances of each TA in the complete dataset of clinical trials analyzed).
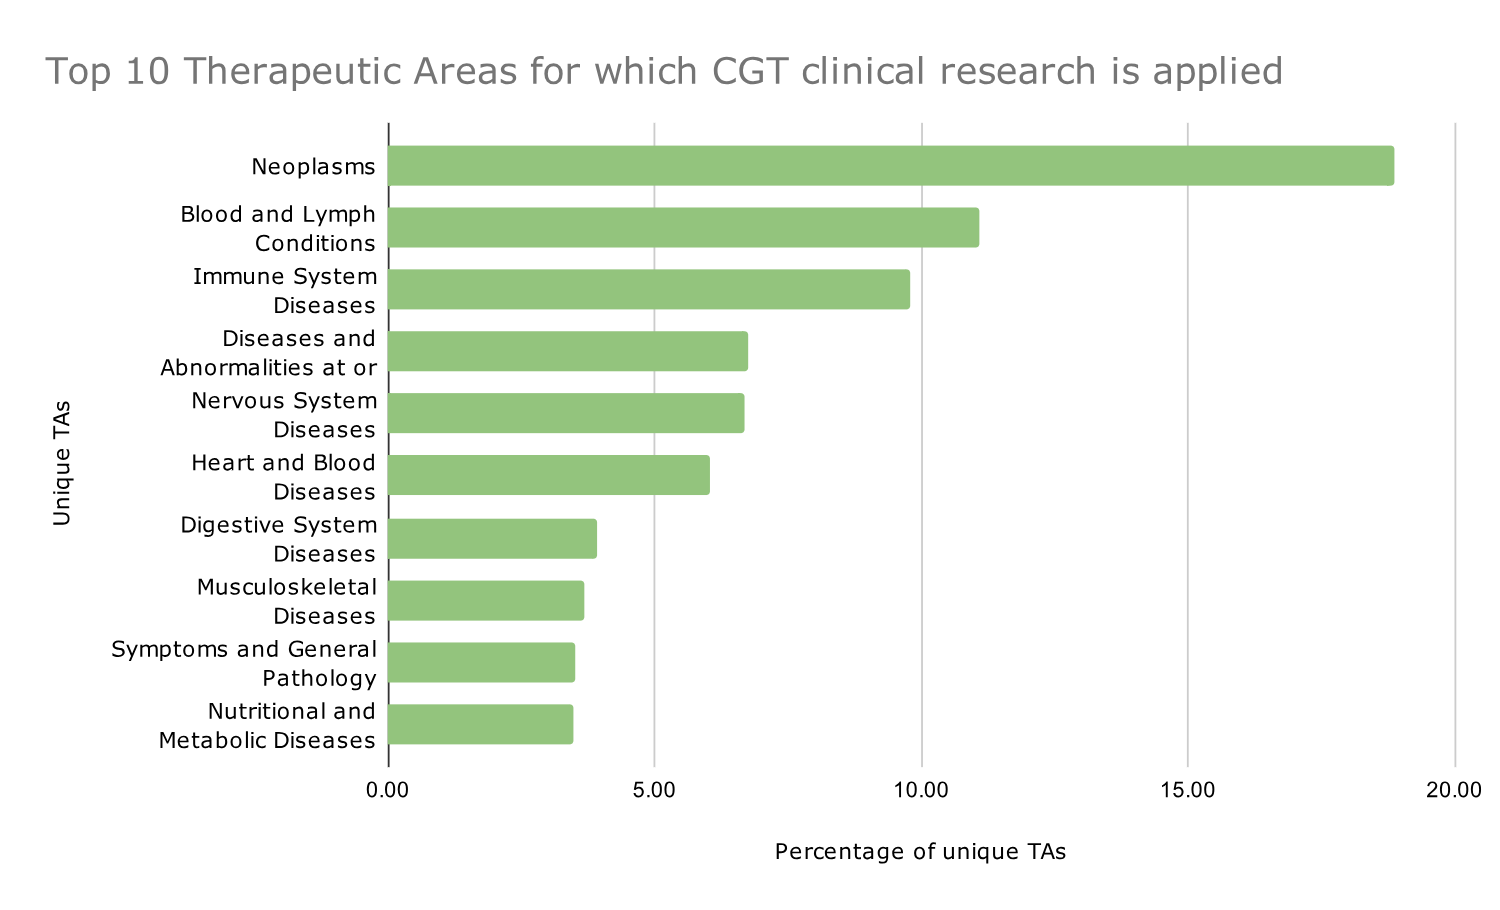
Graph 1: Distribution of the top 10 therapeutic areas for cell and gene therapy-based clinical trials from 2014 to 2023. Data are shown as percentages.
Graph 1 shows the percentage of each one of the Top 10 TAs included in the dataset in descending order, and the word cloud in Image 2 shows all the different TAs included in the dataset.

Image 2: All Therapy Areas included in the dataset
Novartis and Pfizer are among the Top 5 companies for total CGT clinical trials and phase 3 CGT clinical trials.
The top 20 companies with the highest aggregate number of CGT clinical trials over the past decade (2014-2023) were identified from a dataset of over 300 companies ranked by the cumulative count of CGT trials across all development stages.
As expected, there are fewer trials in later phases than in the early stages. Meanwhile, the companies with the most CGT trials differ from those with the most late-stage development trials. For example, Yake Biotech had the most trials of all companies in the dataset, but 20 out of 22 were in the early phase 1 development stage (Graph 2).
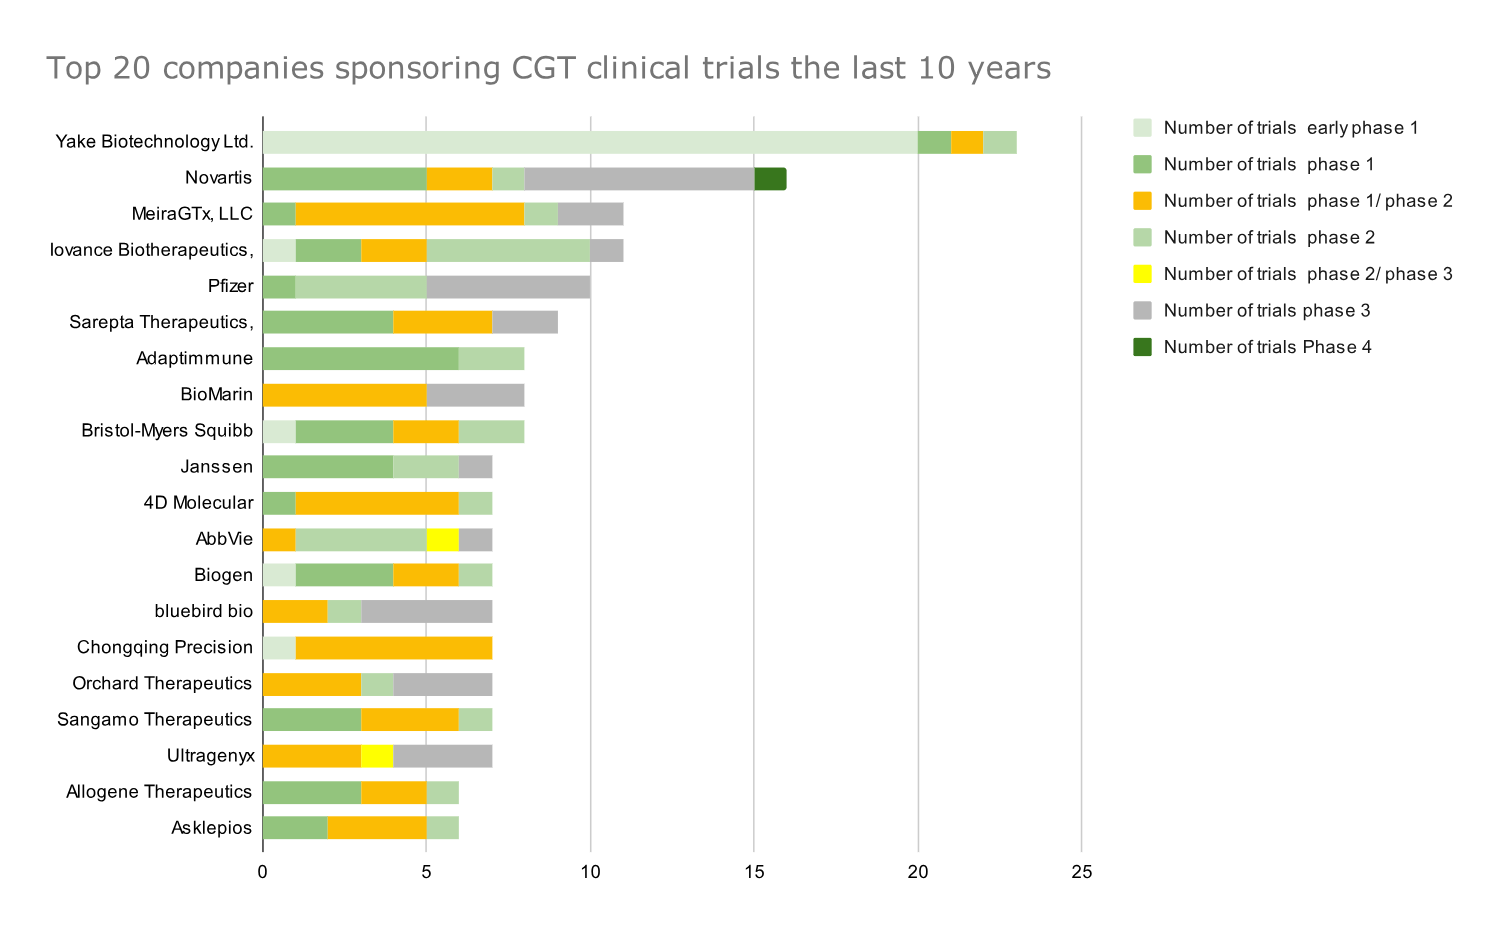
Graph 2: Top 20 companies that sponsored the most CGT clinical trials in all phases of development from 2014 to 2023. Data presented as absolute numbers of clinical trials.
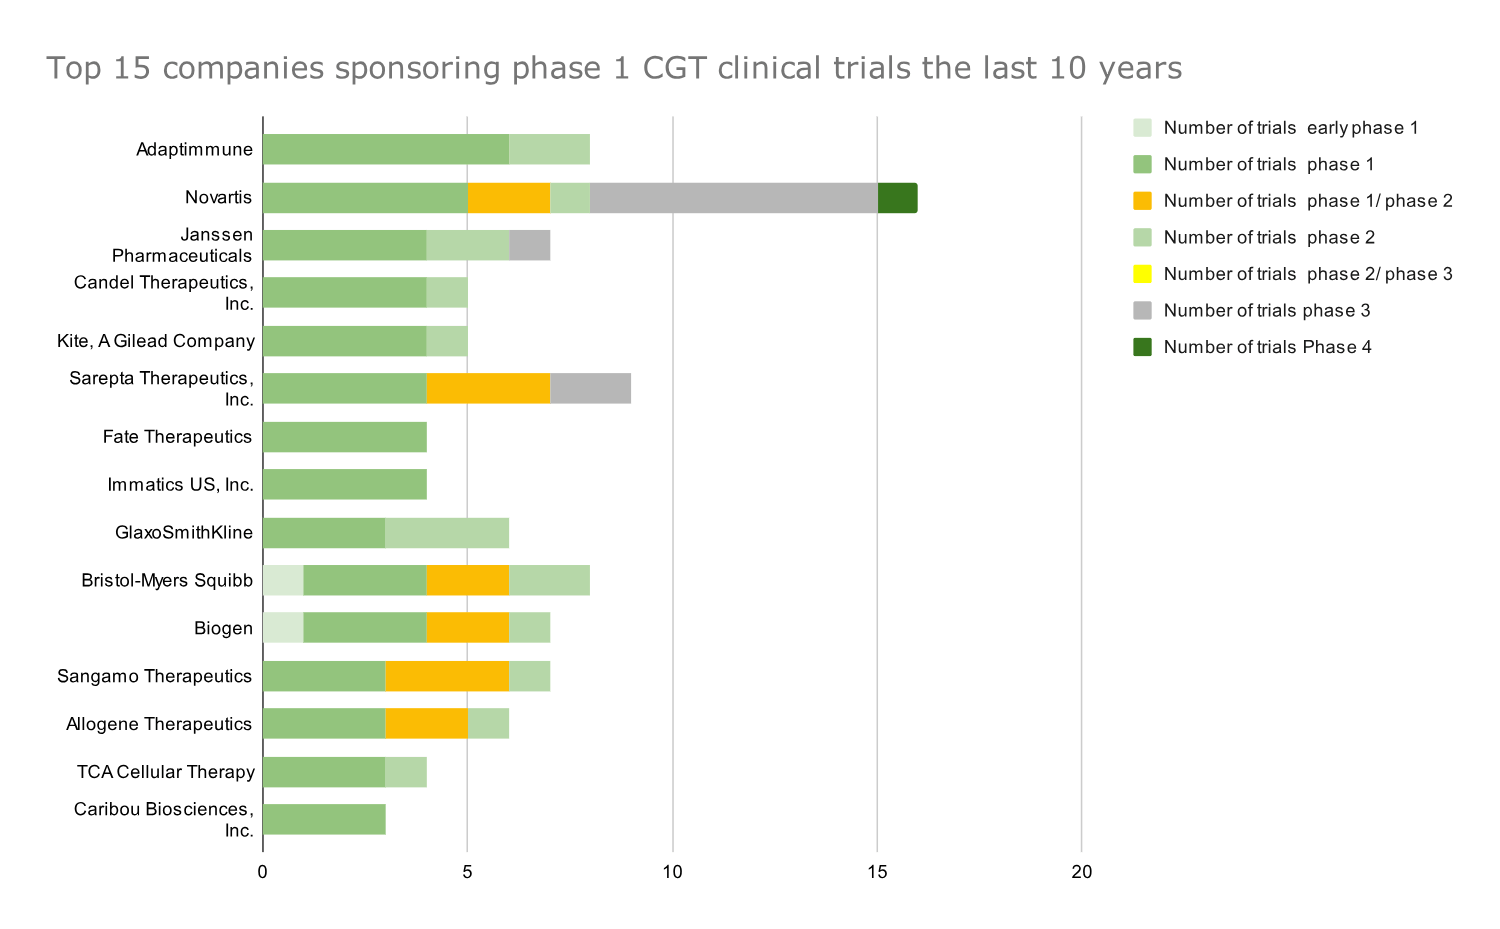
Novartis and Pfizer, on the other hand, were prominently ranked in the Top 5 for the total number of trials and the number of phase 3 clinical trials.
The identified top players for both the total number of trials and the number of phase 3 clinical trials hold potential breakthrough drugs like Beqvez (Pfizer), Lyfgenia (Bluebird Bio), Roctavian (Biomarin), and Elevidys (Sarepta) in their portfolio.
Partnerships are crucial for the development of cell and gene therapy treatments due to scale and production demands. The companies mentioned in this report have already established partnerships and agreements, e.g., 1) Adaptimmune partnered with Genentech, 2) Novartis with Voyager and Avrobio, 3) MeiraGTx with Janssen, and 4) Sarepta with Roche.
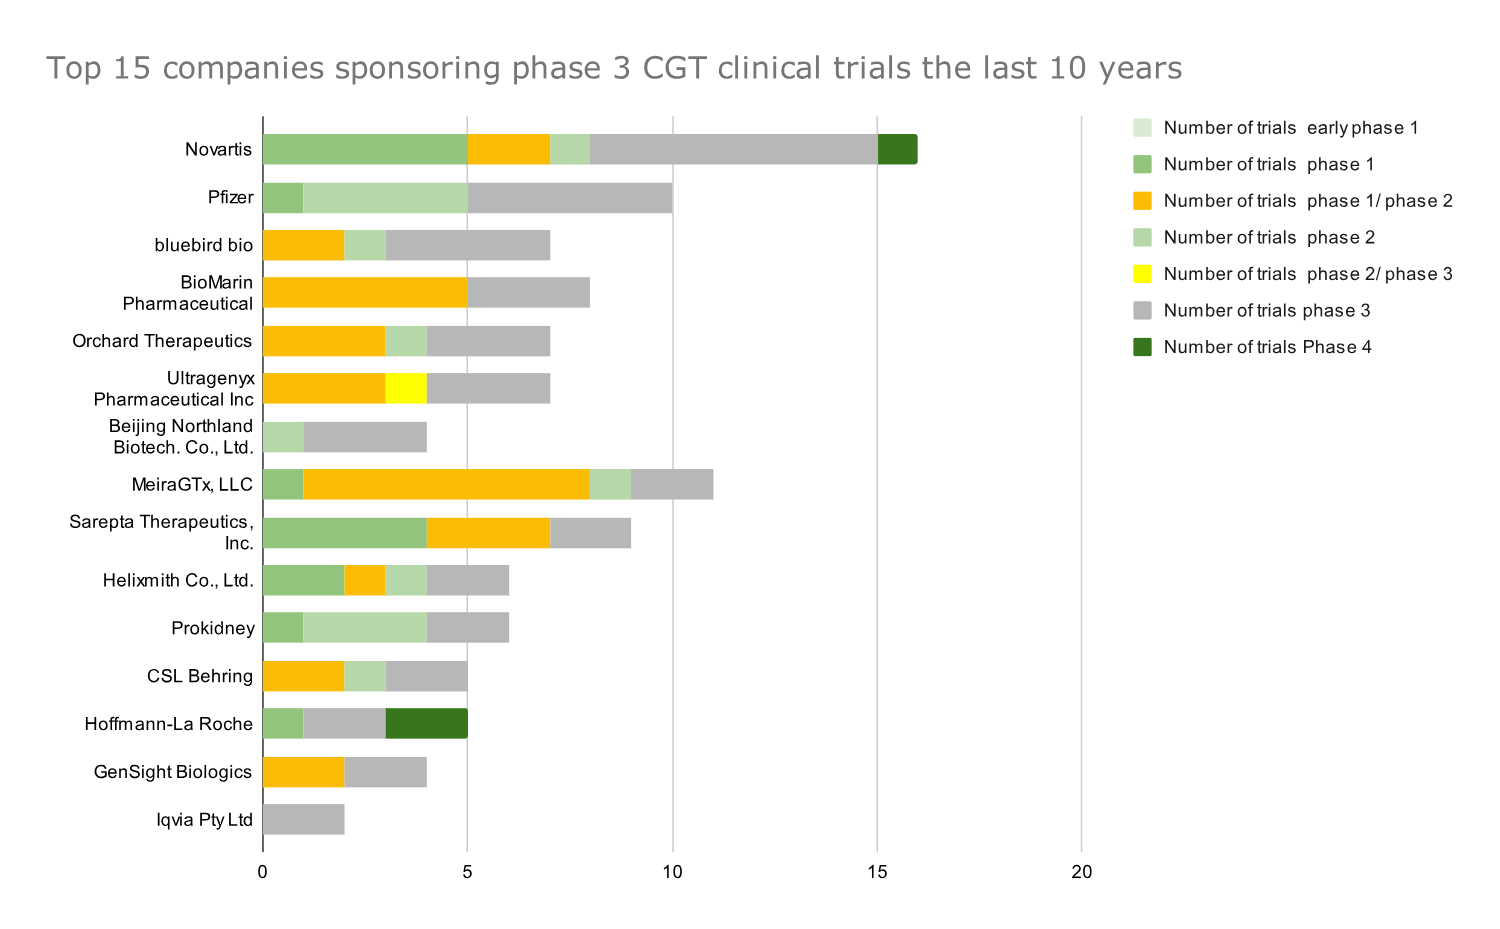
Graph 3: Top 15 companies that sponsored the most phase 3 CGT clinical trials in 2014-2023. Data presented as absolute numbers of clinical trials; all trials by a company are depicted but ranking is based on the number of phase 3 CGT trials for each company.
Companies with a focus on cell therapy at the top of early-stage CGT trials
Companies focusing on CGT are ranked first in the top lists of phase 1 and phase 2 clinical trial players, while big pharma are also ranked high. Below are the key findings from the analysis of the top players in early-stage, phase 1, and phase 2 trials.
- Iovance Therapeutics has been ranked first in phase 2 CGT trials for the last ten years.
- Adaptimmune has conducted most phase 1 CGT trials in the last ten years.
- Both companies and several of the following ones have a pipeline focused on T-cell therapies for immuno-oncology. Their high ranking further highlights the need to develop allogeneic cell therapies and cell therapies to treat solid tumors.
- Iovance has one marketed product (Proleukin) and Adaptimmune has no marketed products/therapies in its portfolio (Afami-cel probably will be launched in 2024), dependent on the successful development of those early-stage trials
- Giants like Novartis and Pfizer, which ranked high in the number of Phase 1 and Phase 2 trials, respectively, show their devotion to the cell and gene therapy space with their continuously developing pipelines.
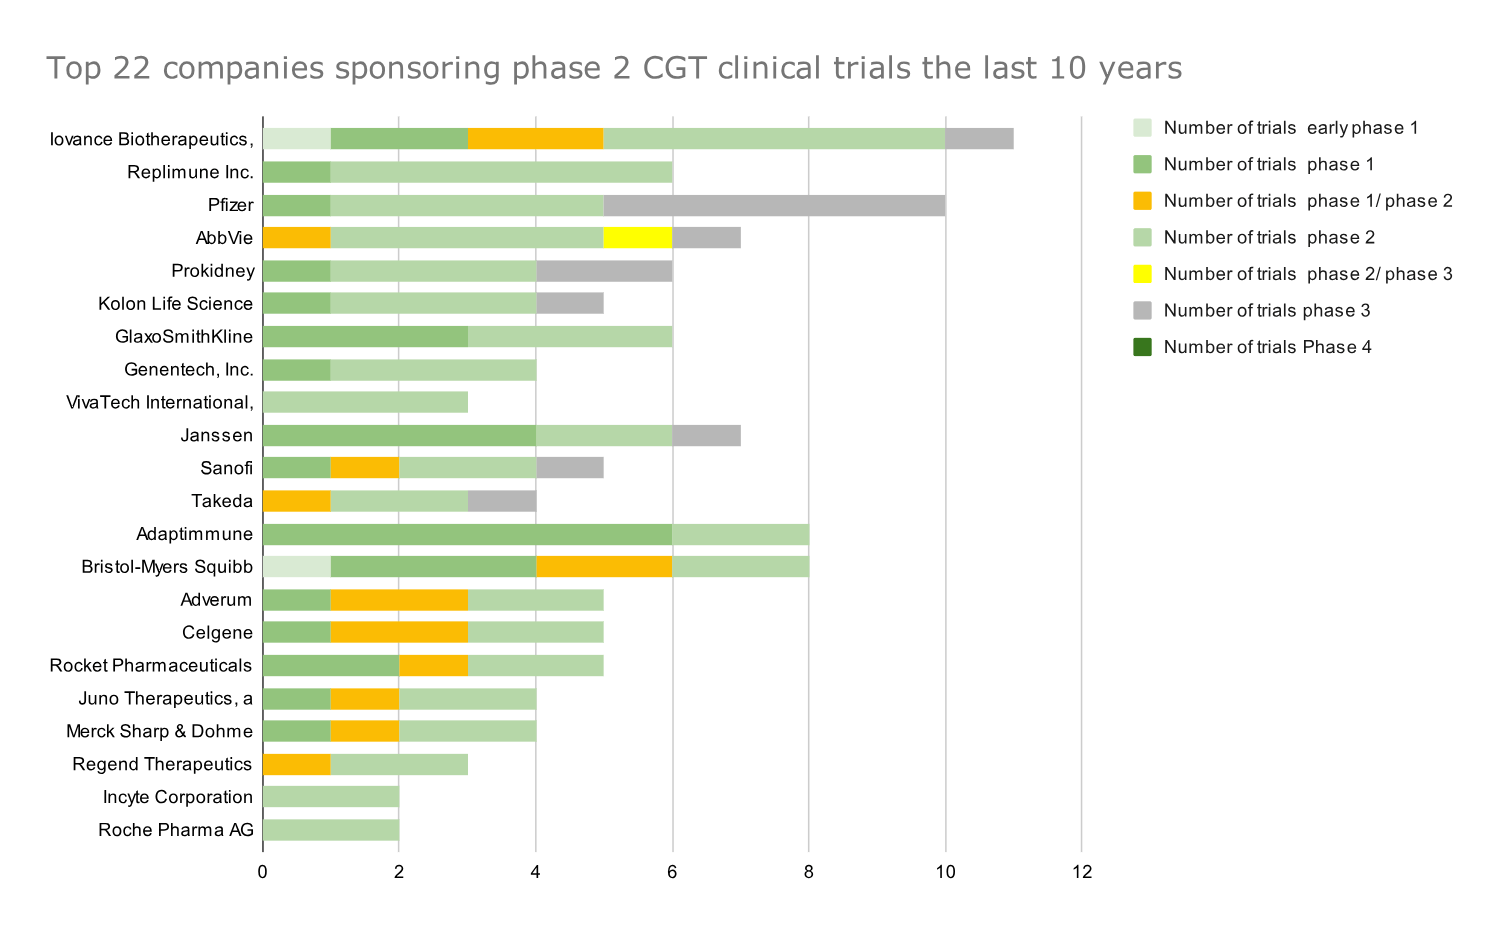
Graph 4: Top 22 companies that sponsored the most phase 2 CGT clinical trials in 2014-2023. Data presented as absolute numbers of clinical trials by each company; companies ranked based on number of phase 2 trials.
Graph 5: Top 15 companies that sponsored the most phase 1 CGT clinical trials in 2014-2023. Data presented as absolute numbers of clinical trials by each company; companies ranked based on number of phase 1 trials.
The number of GCT trials across all development stages began to rise in 2017.
A yearly breakdown by phase shows the evolution of CGT trials through the years and reveals that GCT trials of all development phases started to increase in 2017. The yearly cell and gene therapy clinical trials rose consistently from 2017 to 2021 and dropped in 2022 (probably due to COVID-19) (Graph 6)
In 2017, the first FDA approvals were granted for CGT products, including Loxturna, Yescarta, and Kymriah. Additionally, the use of CRISPR-cas9 in clinical trials also contributed to the rise of CGT trials from 2017 onwards.
Regulatory agencies, including the FDA and EMA, began adapting regulatory frameworks and releasing guidance documents to address the unique challenges posed by innovative therapies like cell and gene therapies. The regulatory landscape continued to evolve in the following years, with expedited review pathways, such as the FDA’s Regenerative Medicine Advanced Therapy (RMAT) designation, gaining prominence.
In 2020, there was a substantial increase in the number of phase 1 clinical trials initiated, probably due to the ‘friendlier’ regulatory framework in the US. For example, at the beginning of 2020, the FDA launched the Cell and Gene Therapy Guidance Framework with several updates, guidance, and recommendations, such as 1) long-term safety follow-up with patients who have received human gene therapy products for five to fifteen years after participating in a CGT clinical trial 2) guidance on CGT in rare diseases 3) guidance on CGT manufacturing and 4) Interpreting Sameness of Gene Therapy Products Under the Orphan Drug Regulations.
Data from 2022 show decrease in early-stage CGT trials.
In 2022 we observe a substantial decline in early-stage, phase 1, and phase 2 trials (maybe this has been impacted by the COVID-19 pandemic). However, the development of phase 3 trials remained relatively stable.
Lockdowns, travel restrictions, and safety concerns affected the ability to conduct and monitor trials effectively. Also, some research efforts and resources were redirected toward COVID-19-related studies and vaccine development, potentially reducing fund allocation to non-COVID-19 research areas, CGT included.
CGT trials see an impressive post-pandemic increase
After the pandemic, from 2022 to 2023, there was an impressive increase in CGT clinical trials; the total number of CGT clinical trials in 2023 was four times the number we observed in 2022. One possible reason for the increase in CGT research and development is the recent regulatory approvals of CGT products.
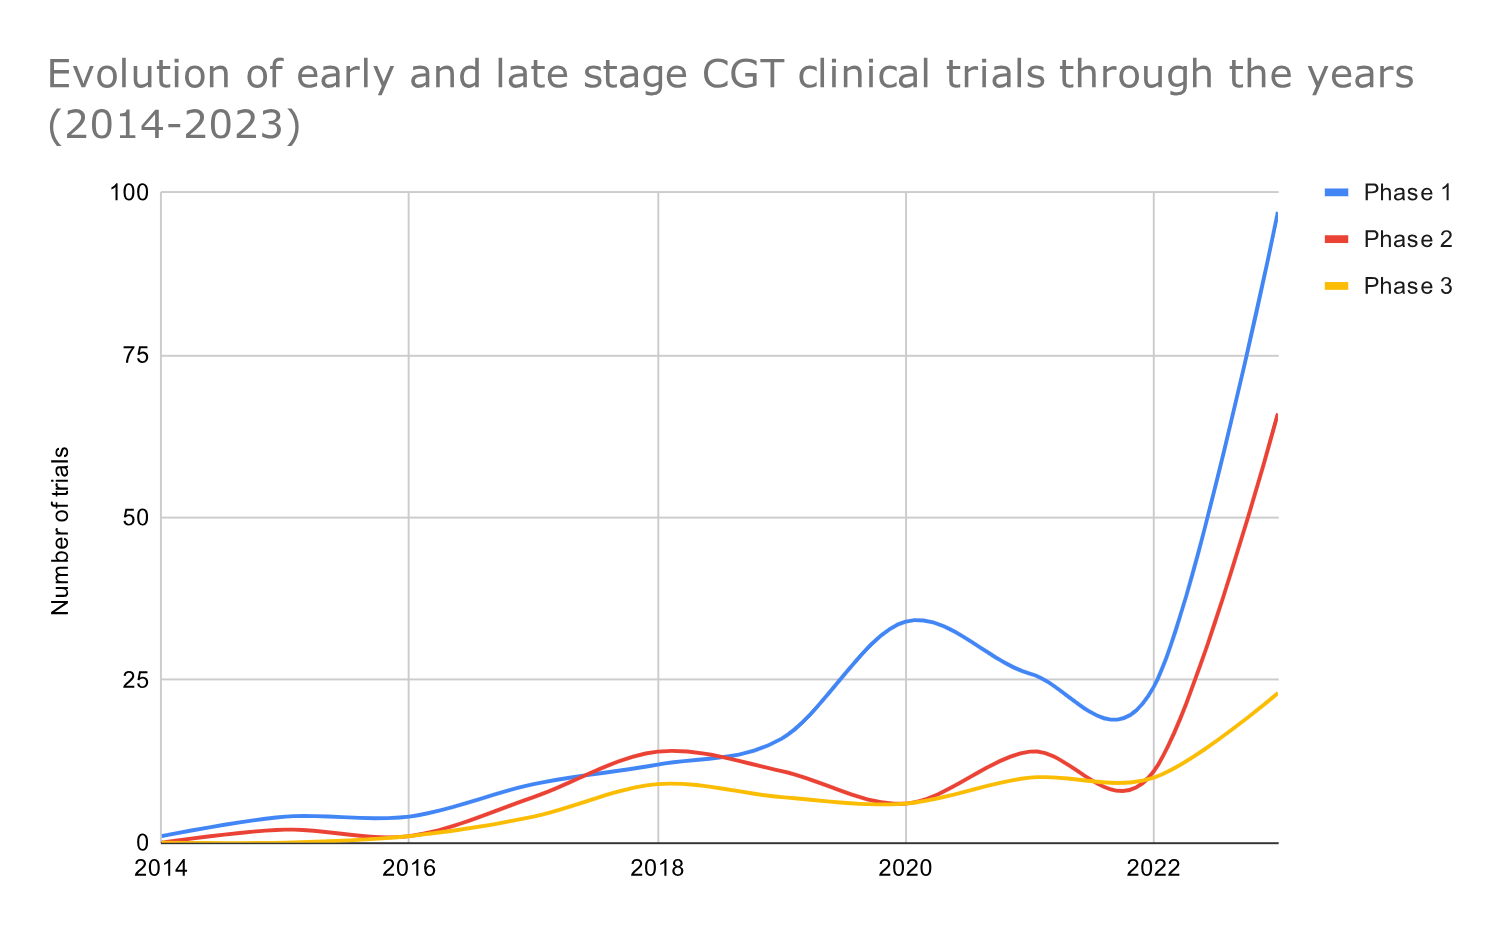
Graph 6: Timeline graph showing the yearly distribution of cell and gene therapy trials across phases
Substantial increase in the number of CGT players in the last five years (2018-2023)
The findings showed an apparent increase (141 vs 429) of almost 200% in the number of players in the CGT space over the last five years. 327 companies out of the 429 companies in the CGT space over the previous five years were new players that hadn’t conducted a clinical trial, according to our dataset before 2019 (Image 3). Below is the number of companies that have worked on CGT trials in the last five years (2019-2024) and the total number of companies that worked on CGT trials from 1998-2018 (Graph 7).
Among the top emerging players in the CGT space are 4D Molecular Therapeutics and Rocket Pharmaceuticals. 4D Molecular Therapeutics’ pipeline is focused on the TAs of ophthalmology, pulmonology, and cardiology, while Rocket Pharmaceuticals is developing CGT therapies for hematology and cardiovascular diseases.
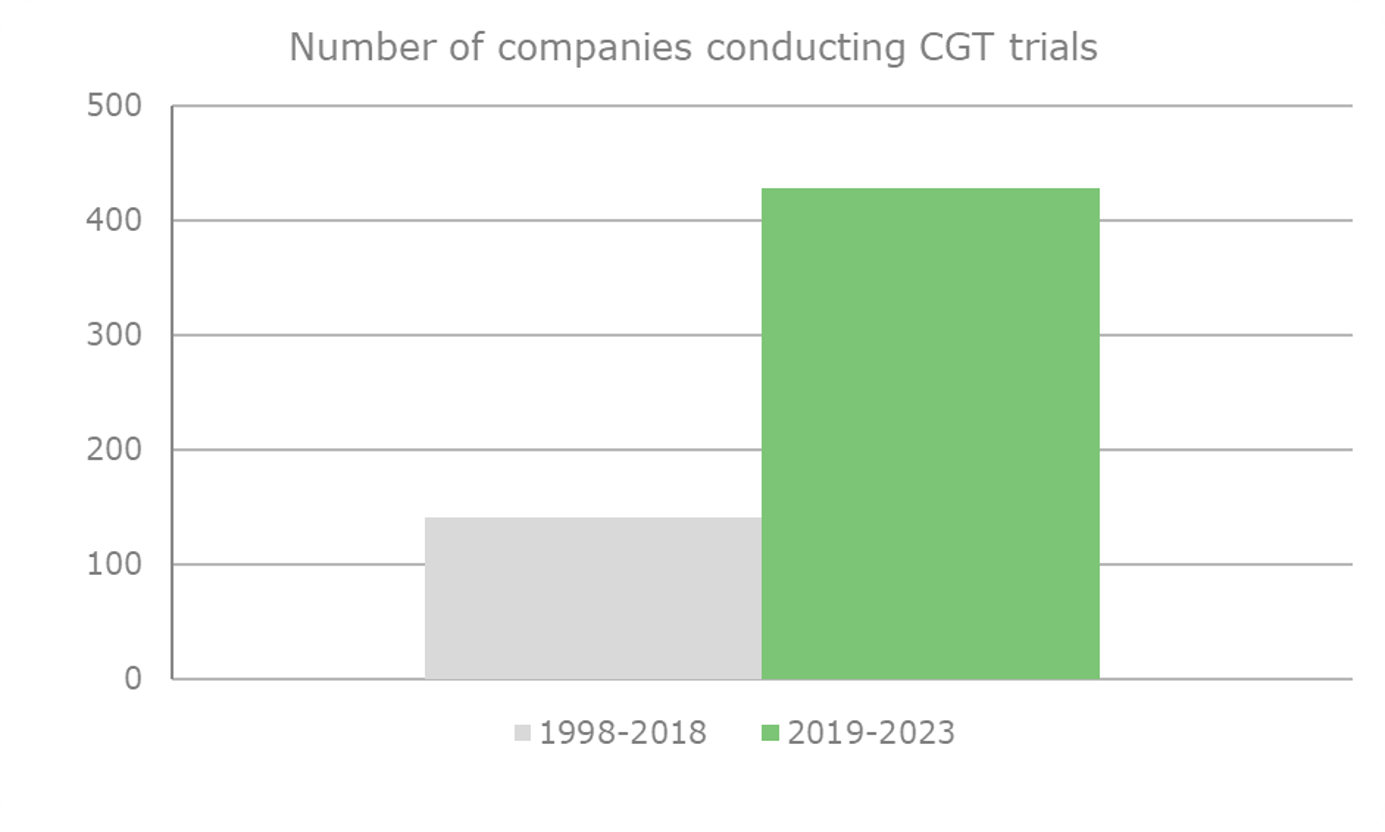 Graph 7: Comparison of number of companies with trials in the cell and gene therapy space between 1998-2018 versus 2019-2023

Image 3: Word cloud illustrating emerging participants in the cell and gene therapy sector that initiated their first trials from 2019 onward
All countries analyzed experienced a rise in CGT trial sites during 2019-2023
In our analysis of the CGT trials landscape, we examined how the distribution of trial sites has evolved across various countries during three distinct periods (2014-2023, as shown in Graph 8; 2014-2018, as shown in Graph 9, and 2019-2023 as shown in Graph 10). This analysis reflects the growth and shifts within the field and highlights the regions leading in innovation and investment in CGT advancements.
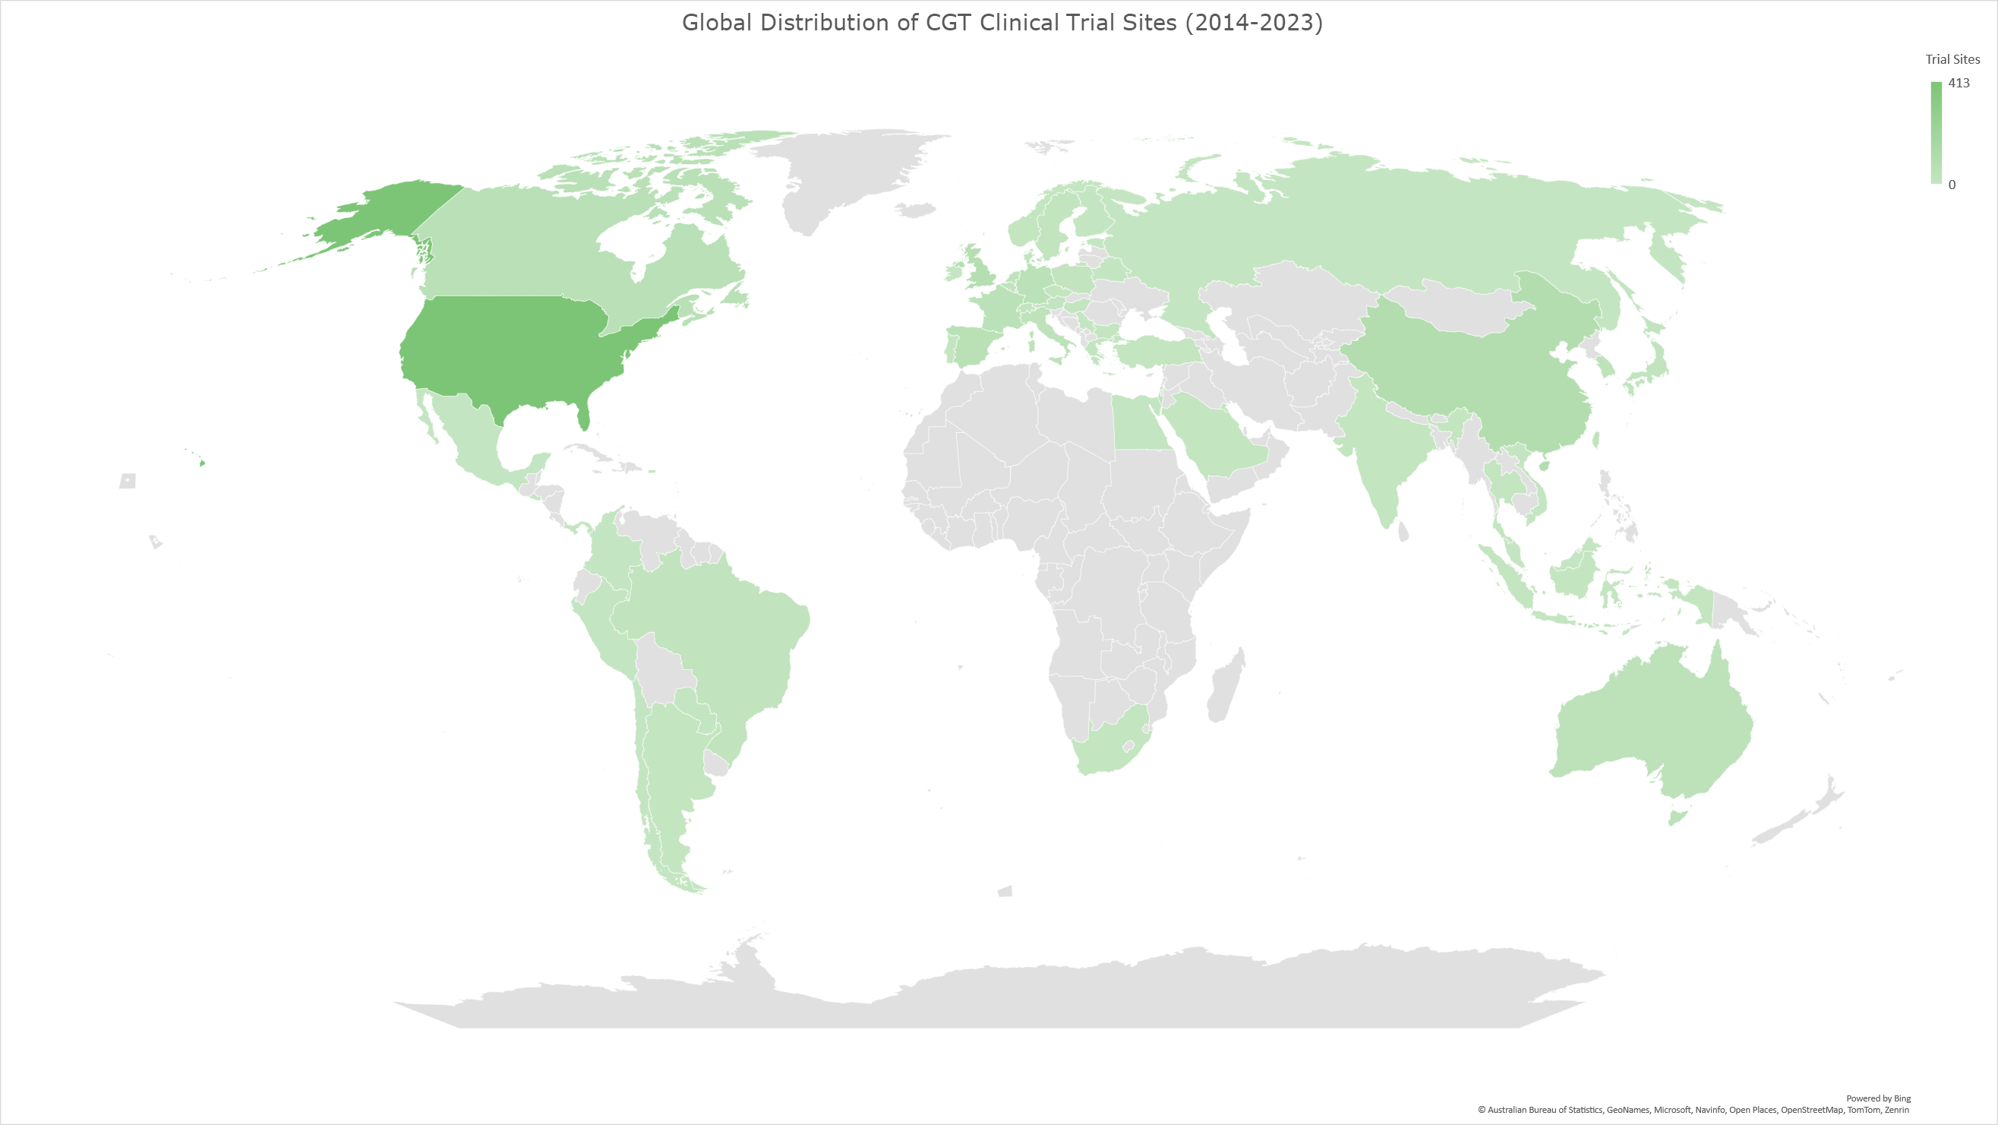
Graph 8: Geomap illustrating the global distribution of CGT clinical trials for the time period 2014-2023. The geomap created by using the locations (clinical trial sites) of each clinical trial, included in the analysis dataset. The majority of clinical trials encompass multiple trial sites distributed across several countries, while a subset of trials is conducted at trial sites within individual countries. The color gradient reflects an ascending order of trial site counts, with darker hues indicating a higher absolute number of trial sites and lighter hues denoting fewer trial sites in the respective geographies.
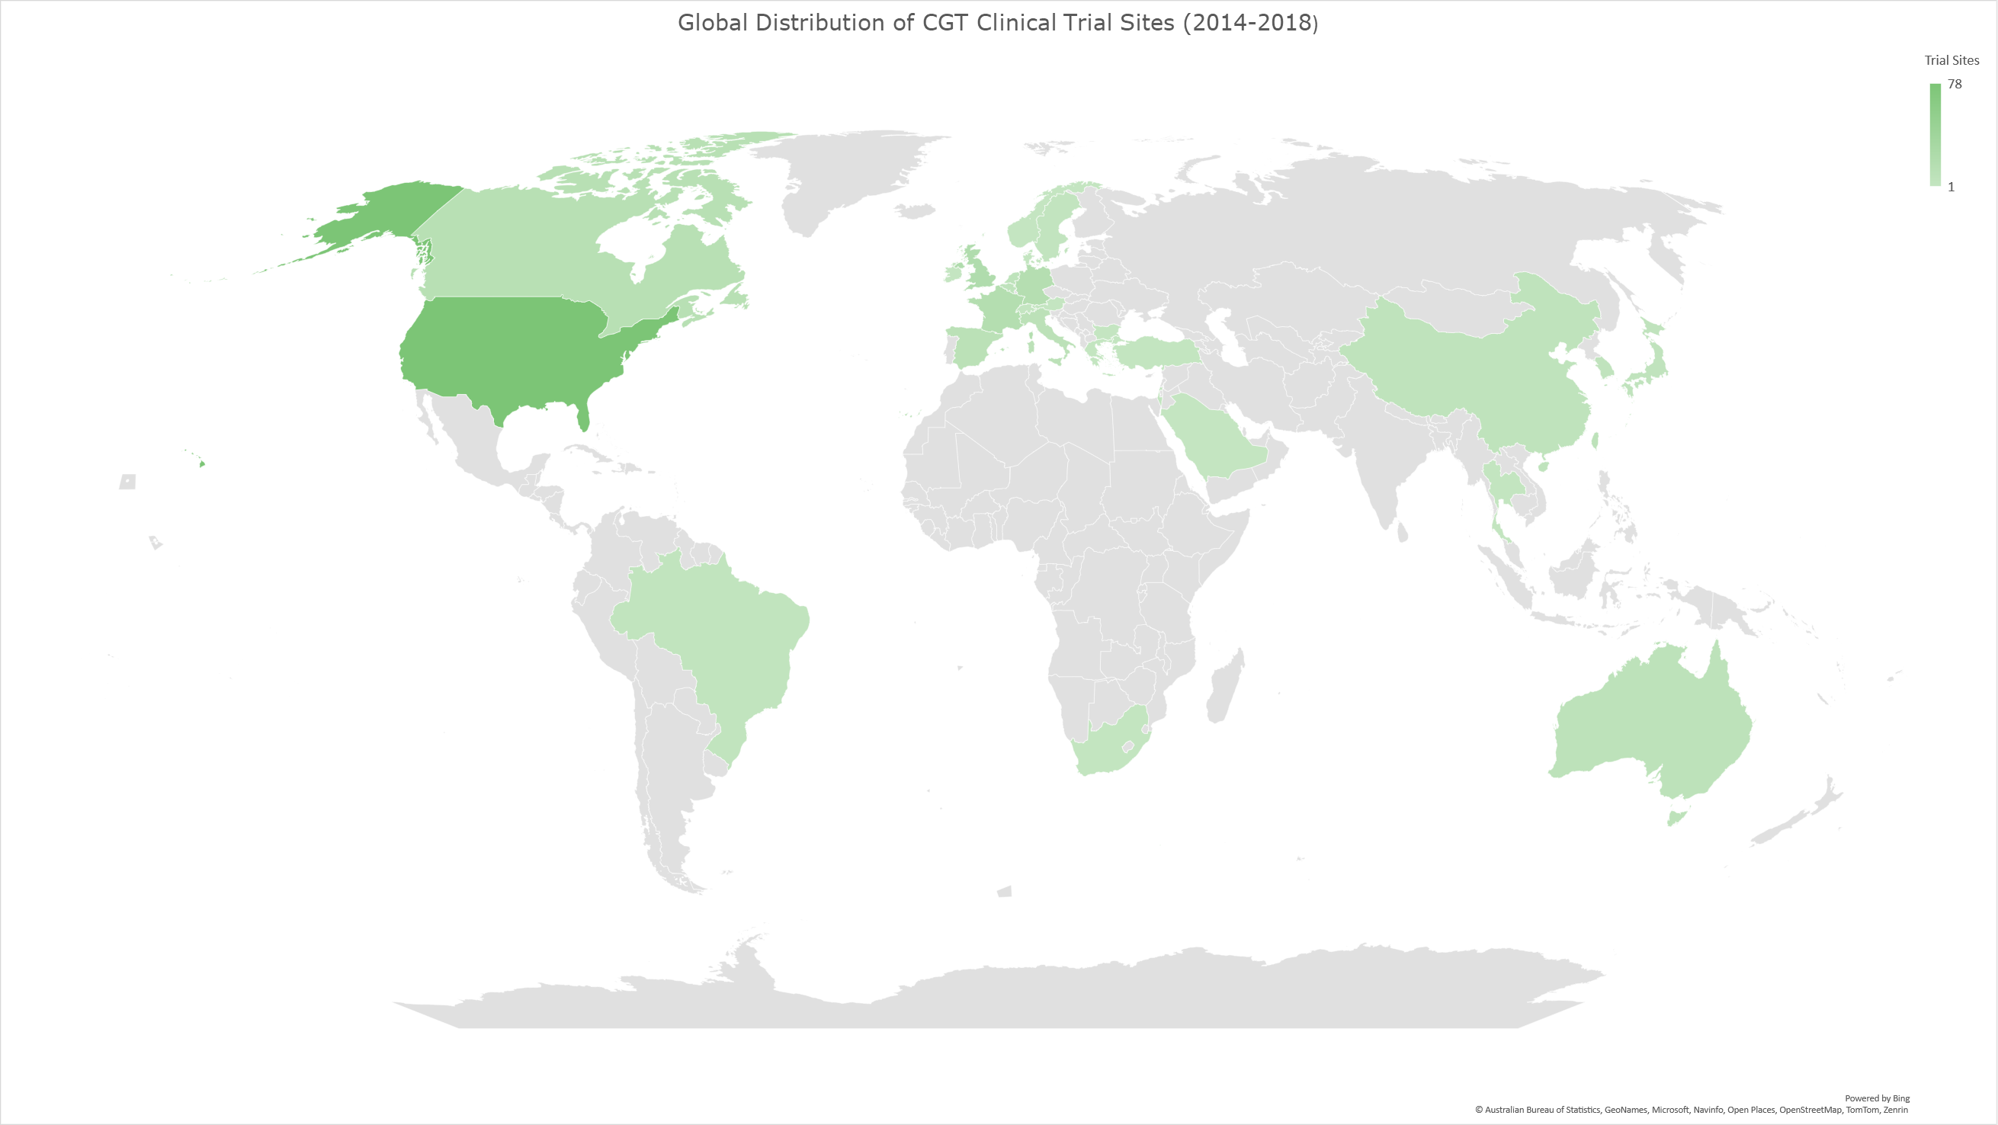
Graph 9: Geomap illustrating the global distribution of CGT clinical trials for the time period 2014-2018. The geomap created by using the locations (clinical trial sites) of each clinical trial, included in the analysis dataset. The majority of clinical trials encompass multiple trial sites distributed across several countries, while a subset of trials is conducted at trial sites within individual countries. The color gradient reflects an ascending order of trial site counts, with darker hues indicating a higher absolute number of trial sites and lighter hues denoting fewer trial sites in the respective geographies.
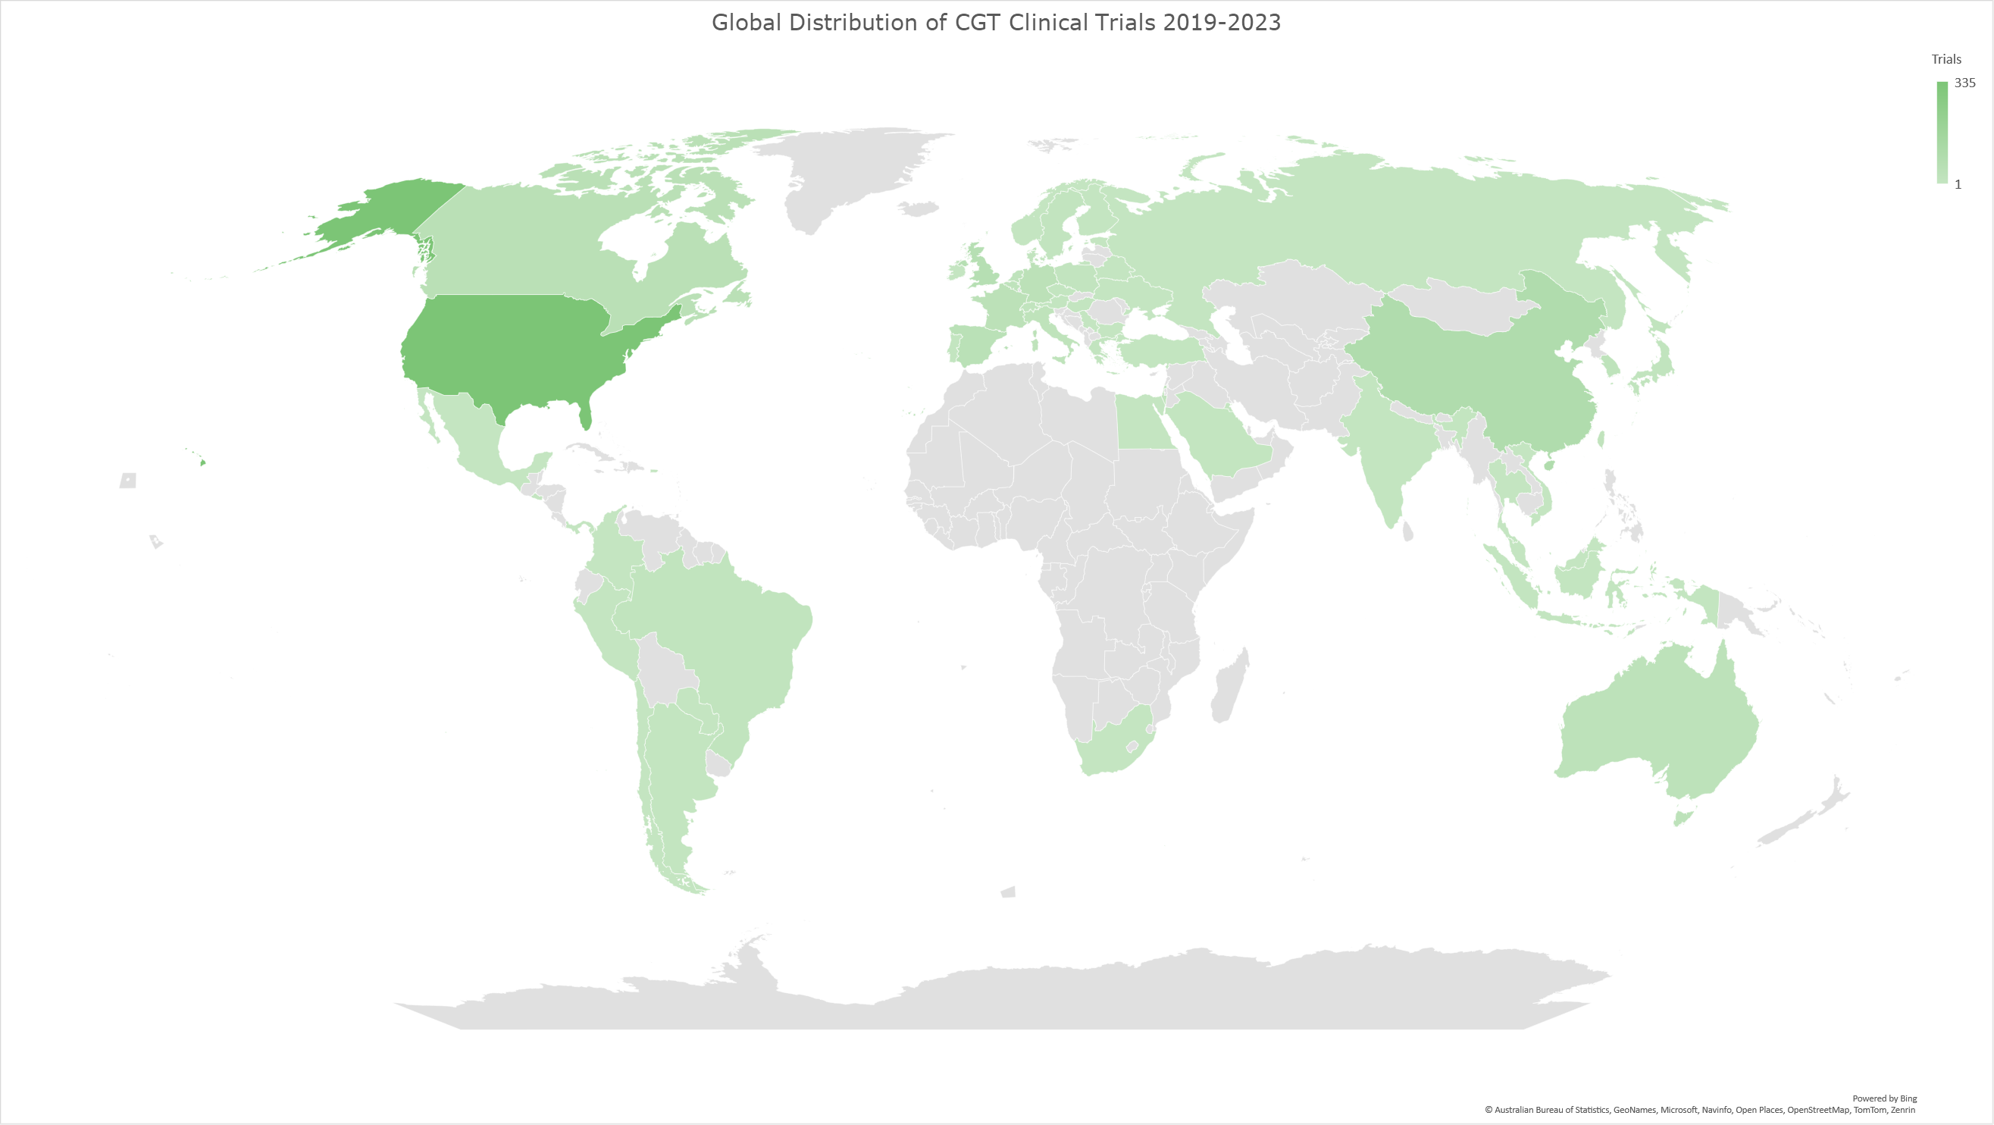
Graph 10: Geomap illustrating the global distribution of CGT clinical trials for the time period 2019-2023. The geomap created by using the locations (clinical trial sites) of each clinical trial, included in the analysis dataset. The majority of clinical trials encompass multiple trial sites distributed across several countries, while a subset of trials is conducted at trial sites within individual countries. The color gradient reflects an ascending order of trial site counts, with darker hues indicating a higher absolute number of trial sites and lighter hues denoting fewer trial sites in the respective geographies.
China and Switzerland show the most notable increase in CGT clinical trial sites.
Our analysis revealed that China and Switzerland had the most notable increases (%-wise) in CGT trial site locations. (Graph 11) The following section will explore the potential factors contributing to this remarkable growth within these two countries, emphasizing their impact on global CGT advancements.
Graph 11 displays the percentage of increase of CGT trial sites per country in 2019-2023 compared to 2014-2018. Table 1 shows the absolute numbers of CGT clinical trial sites for each period per country. The last column shows the percentages shown visually in Graph 11.
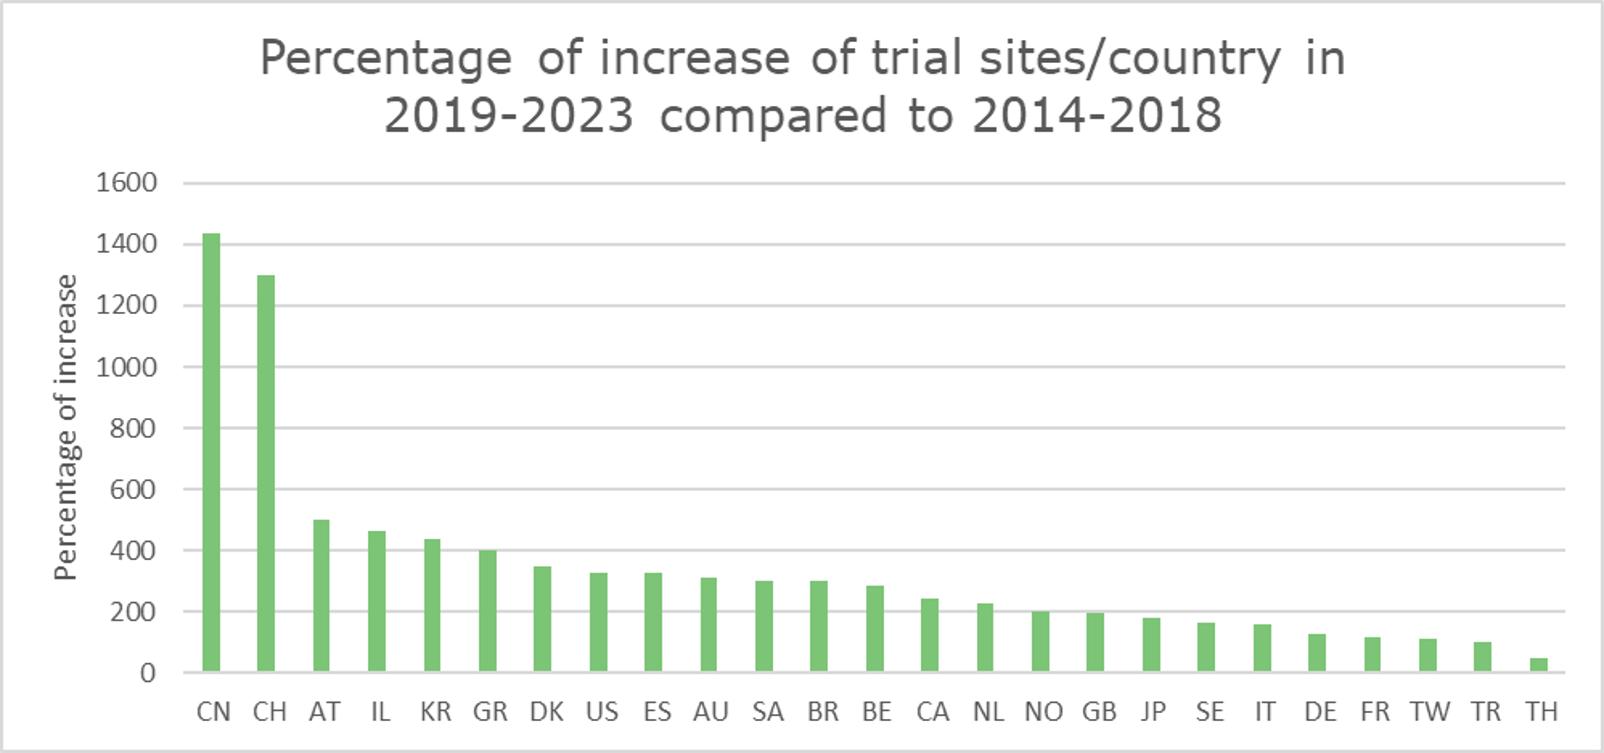
Graph 11: Graph showing the percentage of increase of CGT trial sites per country in 2019-2023 compared to 2014-2018. The percentage is calculated based on the absolute number of clinical trials conducted in the sites across the countries for the two time periods.
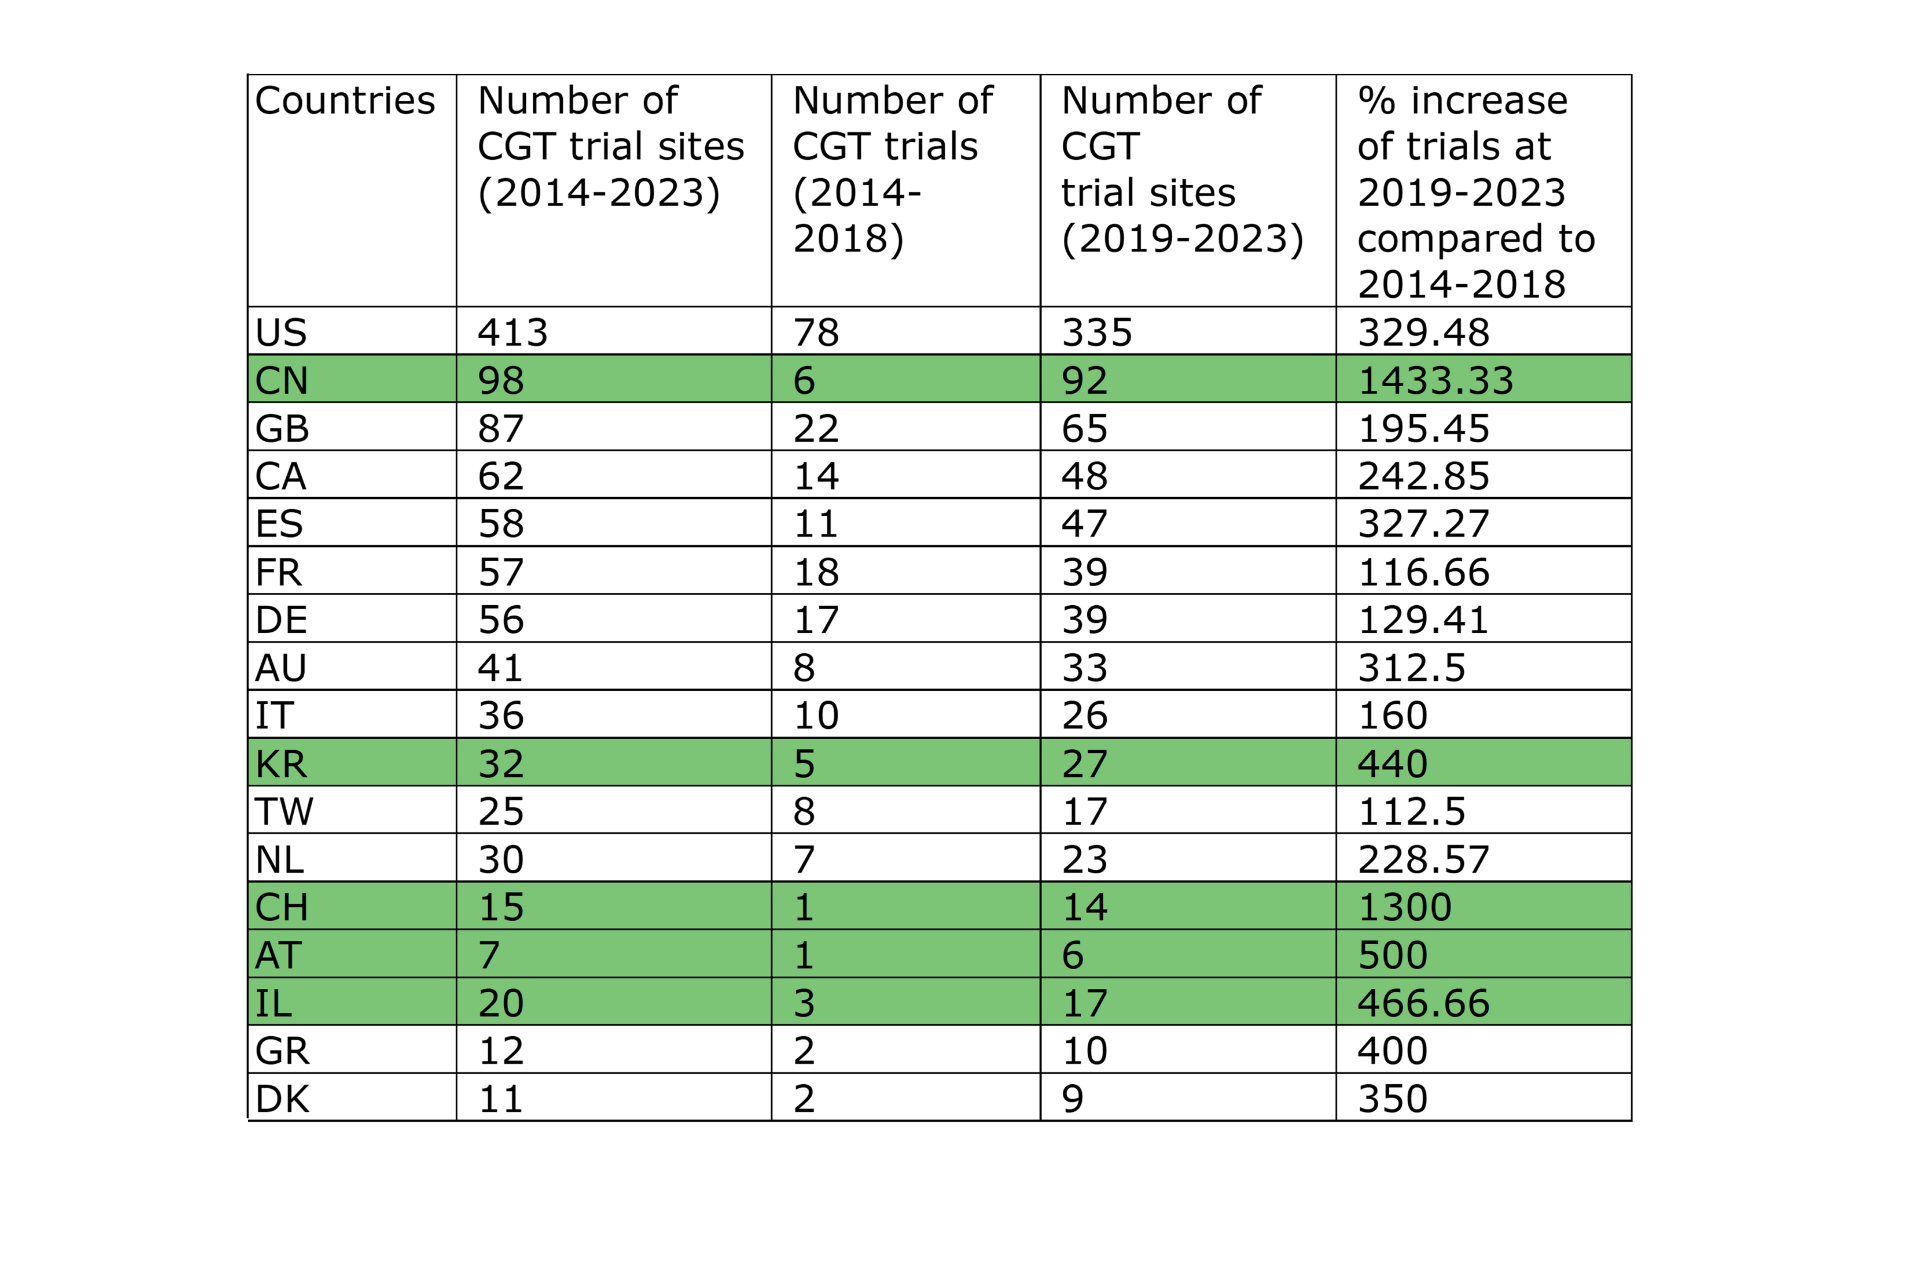 Table 1: Table showing absolute numbers of clinical trial sites in each period and the percentage of increase of CGT trial sites per country in 2019-2023 compared to 2014-2018. The percentage calculated based on the absolute number of clinical trials conducted in the sites across the countries for the two time periods. The rows highlighted in green show the countries where the most notable increases were observed.
The regulatory environment and funding opportunities are possible reasons behind Switzerland’s and China’s leading positions.
The China case
1. Strong focus on CAR-T therapy: With numerous trials, several approved drugs, and competitive pricing, China dominates CAR-T space. More than half of all CAR-T trials today are conducted in China, which is more than double that of the U.S.
2. Supportive regulatory environment: The dual-track regulatory system in China for CGT facilitated their development after 2017.
3. Chinese scientist-driven local research: Local incentives took place in major cities to foster the growth of innovative cell therapy drugs.
4. Global interest: Interest from Southeast Asian companies and opportunities for international collaboration to expand into Chinese and global markets.
5. Increasing patient population: Unmet medical needs due to the high incidence of solid tumors and patient willingness to participate in trials.
The Switzerland case
1. Favorable regulatory environment: Switzerland’s regulatory framework for cell and gene therapy products (CGTPs) is well-structured and cooperative, streamlining the process and emphasizing alignment with global standards and a risk-focused evaluation strategy.
2. Swiss Hub: Switzerland is a CGT companies’ center with established players and small biotech start-ups. Roche, Novartis, and Johnson & Johnson have invested in facilities, with Novartis’ $91 million strategic investment being one of the most notable.
3. Supportive ecosystem and funding οpportunities: Switzerland is an attractive region for investors. Only, in 2021, the total amount of venture capital and private equity investments was $550 million.
Conclusion: A supportive regulatory environment favors industry-sponsored investments in CGT trials for existing and new players.
In analyzing the CGT clinical trials landscape from 2014 until now, we identified that the major therapeutic areas to which CGT is applied are neoplasms and blood and lymph conditions. The CGT space started to evolve rapidly, mainly after 2017, and in 2023, there was a substantial increase in the initiation of new trials. The increasingly conducive and supportive regulatory environment has facilitated the accelerated transformation within CGT and is fostering a rapid evolution in the field.
Both established pharma companies and emerging players, with the latter posing a potential threat to the former, are the key sponsors of most CGT clinical trials. The evolution within the sector is substantiated by the proliferation of new entrants, attesting to the robust growth and dynamism in the CGT industry. Switzerland and China score high in CGT trial sites increase with their regulatory environment and funding opportunities being possible reasons behind their leading positions.
CGT therapies have started to significantly impact the pharmaceutical industry, but their full potential is still unrealized. While the CGT landscape holds significant promise, it is imperative to acknowledge that the sustainability of its development is contingent upon establishing reasonable drug pricing structures. The current trajectory of excessively high drug prices poses a substantial threat to the continued advancement of the CGT space.
Do you want to stay updated with the latest advancements in the Cell and Gene Therapy Clinical landscape?
Contact us and gain best-in-class market insights. Learn how we help you make better informed decisions.
#CellandGeneTherapy #GeneTherapy #CellTherapy #ClinicalTrials #Pfizer #Novartis #BluebirdBio #Biomarin #Elevidys #Sarepta #Adaptimmune #Genentech #Novartis #Voyager #Avrobio #MeiraGTx #Yescarta #Kymriah #Luxturna #FDAapproval
Sources:
Prominent cell and gene therapy vendors in 2023
Next-Gen Partnerships: The Ascent of Advanced Therapies
https://friendsofcancerresearch.org/cell-gene-therapies/
https://alliancerm.org/wp-content/uploads/2018/06/ARM-RMAT-Webinar-Slides-PDF.pdf
https://www.drugdiscoverytrends.com/100-top-cell-gene-therapy-companies-watch-2023/
https://www.panda-int.com/insights/how-is-switzerland-innovating-the-cell-and-gene-therapy-field-/
Novartis Stein Cell and Gene Therapy Facility, Switzerland.
https://www.novartis.com/news/novartis-opens-facility-innovative-cell-and-gene-therapies-switzerland
Building a biotech hub: Switzerland puts the focus on personalized medicine, mRNA, CGT and more